Site Inspection
Aerial Photography
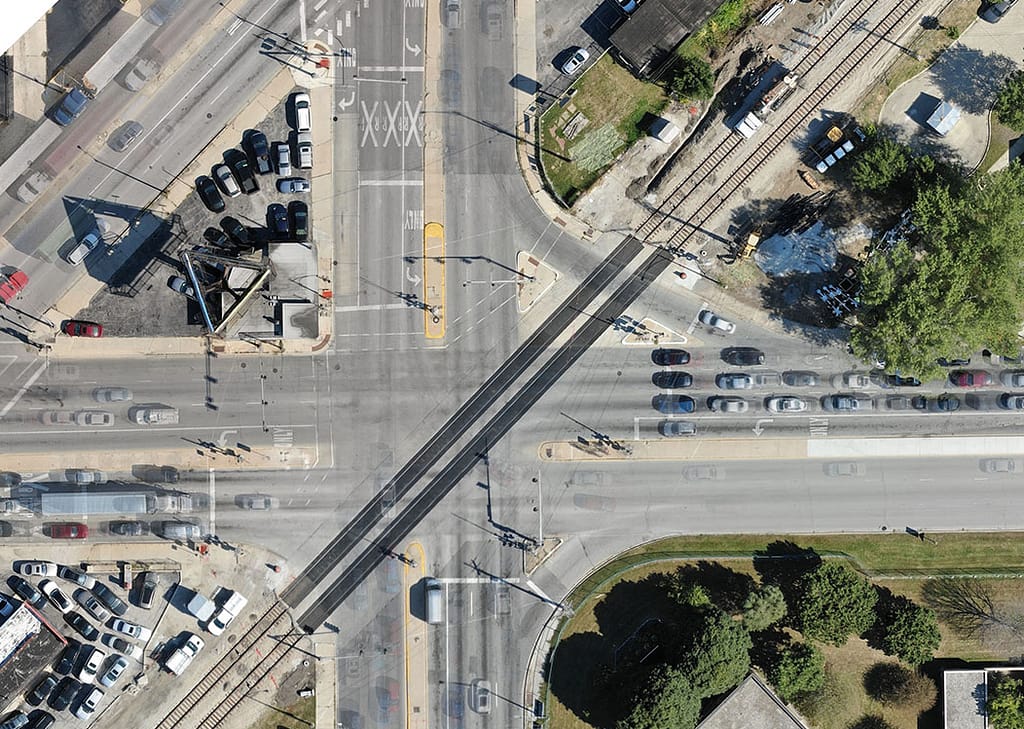
High-resolution cameras mounted on our Unmanned Aerial Vehicles (Drones) capture and preserve your site using aerial photographs, site maps, birds-eye perspectives, 4K video, and photogrammetry data.
Laser Scanning
Our laser scanners capture millimeter accurate 3D data and photography of the area. Collecting ground data, vertical site objects, vehicles, and other evidence at the scene.
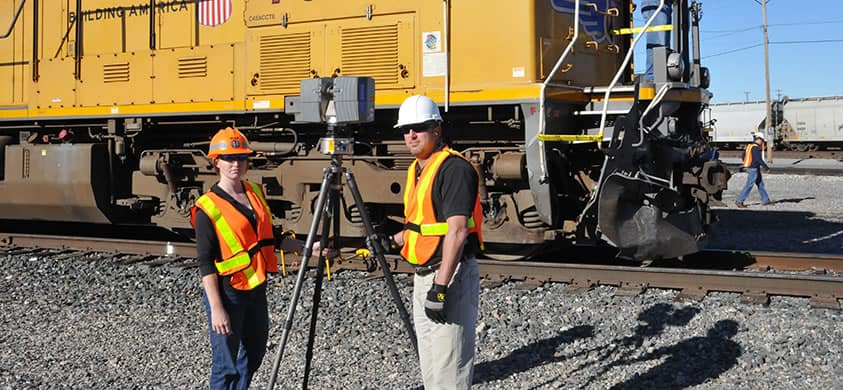
Survey & Measurement

We use survey grade GPS equipment to globally register the aerial photographs, laser scans and accident site information we collect.
Point Clouds

The culmination of all the data we collect is processed and combined into one 3D point cloud. Point clouds consist of millions of data points that look similar to an x-ray. Point-to-point measurements can be taken at any location and they become the foundation for analysis, reconstruction and visualization.
Photo Audio Video
Video Analysis

We use specialized software to repair, enhance and analyze surveillance videos from a variety of sources such as locomotive cameras on trains, parking lots, and office complexes as well as from witnesses using their phone cameras.
Photogrammetry

Photogrammetry is the process of mathematically extracting 3D measurement data from photographs. We also use photogrammetry to build three-dimensional models from aerial photos collected from our drones. Additionally, by overlaying accident photos with laser scans and other 3D data, we can extract valuable information such as the location and dimension of tire marks, vehicle positions, or the location and size of vegetation obstructions. This allows us to rebuild the site as it existed at the time of the accident, even if it has changed.
Videogrammetry

Videogrammetry takes photogrammetry a step further by using video instead of photographs. This enables us to calculate location, time, and distance information for moving objects such as cars, trains and people. This often becomes the basis for our accident reconstruction analysis.
Investigation
Lighting Studies

Lighting studies are used to determine how much light was present at the time of the accident. During the site inspection we use photometry equipment to determine luminosity, contrast, and reflective values for both daytime and nighttime accidents. This information is then incorporated into the overall visibility analysis and other visualization exhibits.
Visibility Analysis

There are many factors that make up visibility, including environmental factors such as contrast, luminosity, distance, and line-of-sight. Because we construct 3D computer models of the accident site, we can precisely determine what is visible and what is not from any location. This is valuable information when determining human factor issues such as attention, distraction, and perception.
Acoustical Studies

For accidents involving advanced warning sounds, such as train horns, we use commercial grade audio equipment to record the intensity and quality of similar warning devices at the time of the accident. The calibrated sound can then be played back or become part of a visualization that is shown in the courtroom.
Visualization
Animation

Animation is one of the best ways to visualize and quickly explain complex time/distance issues in an accident. It begins with an accurate computer model of the site combined with evidentiary data, video, photography, and often, accident reconstruction findings. Once the base structure is in place we can input avoidance scenarios, remove obstructive vegetation, or add active warning devices. The possibilities are endless.
Technical Illustration

Technical illustrations and charts are useful when both qualitative and quantitative information needs to overlayed on drawings, diagrams, and photographs. We can print the illustrations on static boards or incorporate them into interactive slide presentations
Virtual Reality

We were one of the first companies in the country to produce and have fully admitted a virtual reality animation for a civil trial. Virtual reality enables the jurors to experience the accident from the immersive viewpoint of the person(s) involved in the accident. Decisions and reactions in an accident such as “what to look at”, “when to look at it”, and “how visible it was”, can be answered in ways that were not possible before this technology became available.